


Free
Expert Advisors (EAs)
What you'll learn
Understand what Expert Advisors (EAs) are and how they function within MetaTrader platforms
Learn the difference between fully automated and semi-automated trading systems
Discover how to install, configure, and test EAs on MT4/MT5
Explore the basics of backtesting and optimizing EAs using historical data
Understand key concepts like:
Risk parameters
Drawdown limits
Trade filters and time controls
Learn how to evaluate third-party EAs before using them in a live account
Gain awareness of the risks and limitations of automated trading
Free
The Bladerunner Trade
What you'll learn
Understand the core concept and logic behind the Bladerunner Trade
Learn how to use the 20 EMA as a dynamic support/resistance line
Identify valid Bladerunner setups using price action and candlestick confirmation
Know how to trade pullbacks and breakouts with precision
Learn how to place entries, stop-losses, and take-profits based on structure
Discover how to apply the strategy across Forex, crypto, or indices
Analyze real-world trade examples and learn how to avoid common mistakes
Free
Trend and Continuation Patterns
What you'll learn
Understand what market trends are and how they behave
Identify uptrends, downtrends, and sideways/consolidation phases
Recognize key continuation patterns such as:
Flags and Pennants
Triangles (Ascending, Descending, Symmetrical)
Rectangles
Interpret volume behavior during pattern formation
Use these patterns to set entries, exits, and stop-loss levels
Combine trend patterns with other indicators for better accuracy
Free
Understanding Moving Averages
What you'll learn
Understand the concept and purpose of moving averages
Differentiate between Simple Moving Averages (SMA) and Exponential Moving Averages (EMA)
Interpret how moving averages help identify trends and potential reversals
Use moving averages as dynamic support and resistance levels
Apply moving averages in combination with other indicators
Recognize common strategies, such as crossovers and trend-following systems

Free
Technical analysis
What you'll learn
What You Will Learn
By the end of this section, students will:
Understand the fundamentals of technical analysis and why it works.
Learn how to read and interpret basic price charts.
Identify trends, support, and resistance levels.
Recognize simple technical patterns that signal possible market moves.
Gain an introduction to technical indicators used for confirmation.
Free
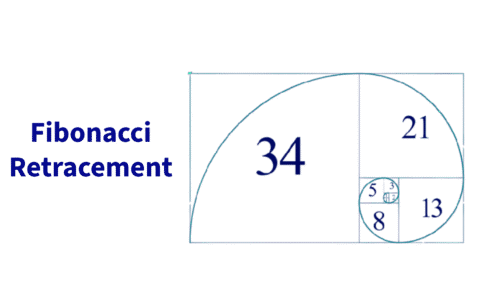
Trading with Fibonacci retracement
What you'll learn
The theory behind Fibonacci retracement and why it works in trading
How to correctly draw and interpret Fibonacci levels on price charts
Identifying confluence zones with Fibonacci and other indicators
Entry, stop-loss, and take-profit strategies using retracement levels
Common mistakes traders make when using Fibonacci — and how to avoid them
Free
Introduction to Technical Indicators
What you'll learn
Students will understand the role of technical indicators in analyzing market trends, momentum, and potential entry/exit points. They will learn how to apply popular indicators such as moving averages, RSI (Relative Strength Index), MACD (Moving Average Convergence Divergence), and Bollinger Bands. The course emphasizes not just using indicators in isolation, but combining them effectively to confirm signals and manage risk. By the end, students will be able to use technical indicators to support their trading strategies with greater confidence.
Free
Introduction to Fundamental Analysis
What you'll learn
Students will gain a strong foundation in understanding how economic, financial, and political factors drive asset prices. They will learn how to interpret financial statements, evaluate macroeconomic indicators, and connect global events to market movements. The course will also teach how to identify undervalued or overvalued assets, analyze company performance, and apply these insights to build long-term trading or investment strategies.
Free
Introduction to Technical Analysis
What you'll learn
The fundamentals of technical analysis and why it’s used across financial markets.
How to read and interpret candlestick charts and price movements.
Key chart patterns such as head and shoulders, triangles, and flags.
How to identify support and resistance levels for smarter trade entries/exits.
The role of trendlines, moving averages, and momentum in market analysis.
Practical strategies to apply technical analysis in real-world trading scenarios.

Free
Advanced technical analysis
What you'll learn
By the end of this section, students will:
Understand how to apply multi-timeframe analysis for stronger confirmations.
Learn how to use Fibonacci retracements and extensions to spot entry and target zones.
Recognize advanced chart patterns such as Head & Shoulders, Triangles, Flags, and Wedges.
Apply oscillators and momentum indicators (RSI, MACD, Stochastic) in advanced contexts.
Integrate multiple indicators and techniques into a cohesive trading strategy.
Free
Fundamental Analysis
What you'll learn
By the end of this section, students will:
Understand the purpose of fundamental analysis and how it differs from technical analysis.
Learn how economic indicators (GDP, inflation, employment, interest rates) affect markets.
Explore how company earnings, balance sheets, and ratios are used in stock analysis.
Recognize the role of geopolitics and global events in shaping market sentiment.
Combine fundamentals with other tools to create a more complete trading picture.