


Free
The Bladerunner Trade
What you'll learn
Understand the core concept and logic behind the Bladerunner Trade
Learn how to use the 20 EMA as a dynamic support/resistance line
Identify valid Bladerunner setups using price action and candlestick confirmation
Know how to trade pullbacks and breakouts with precision
Learn how to place entries, stop-losses, and take-profits based on structure
Discover how to apply the strategy across Forex, crypto, or indices
Analyze real-world trade examples and learn how to avoid common mistakes
Free
What Is Livestock Trading?
What you'll learn
What livestock trading is and which animals are most commonly traded (e.g., live cattle, feeder cattle, lean hogs)
How livestock futures contracts work and where they’re traded (e.g., CME Group)
Key factors affecting livestock prices, including feed costs, weather, and global demand
Strategies for trading livestock: speculation, hedging, and spread trading
Risk management techniques specific to agricultural commodities
Free
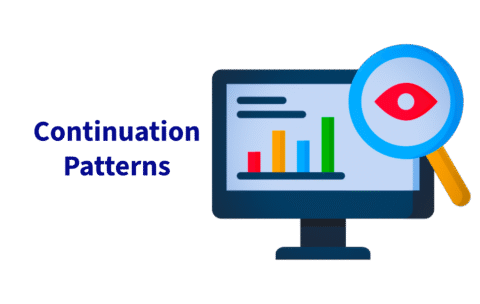
Trend and Continuation Patterns
What you'll learn
Understand what market trends are and how they behave
Identify uptrends, downtrends, and sideways/consolidation phases
Recognize key continuation patterns such as:
Flags and Pennants
Triangles (Ascending, Descending, Symmetrical)
Rectangles
Interpret volume behavior during pattern formation
Use these patterns to set entries, exits, and stop-loss levels
Combine trend patterns with other indicators for better accuracy
Free
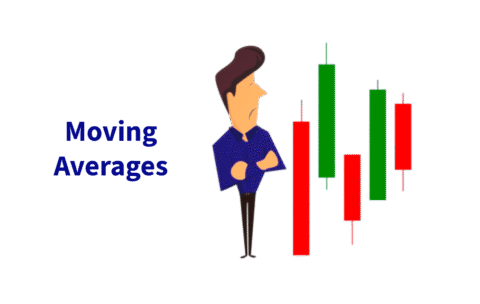
Understanding Moving Averages
What you'll learn
Understand the concept and purpose of moving averages
Differentiate between Simple Moving Averages (SMA) and Exponential Moving Averages (EMA)
Interpret how moving averages help identify trends and potential reversals
Use moving averages as dynamic support and resistance levels
Apply moving averages in combination with other indicators
Recognize common strategies, such as crossovers and trend-following systems
Free
Technical analysis
What you'll learn
What You Will Learn
By the end of this section, students will:
Understand the fundamentals of technical analysis and why it works.
Learn how to read and interpret basic price charts.
Identify trends, support, and resistance levels.
Recognize simple technical patterns that signal possible market moves.
Gain an introduction to technical indicators used for confirmation.
Free
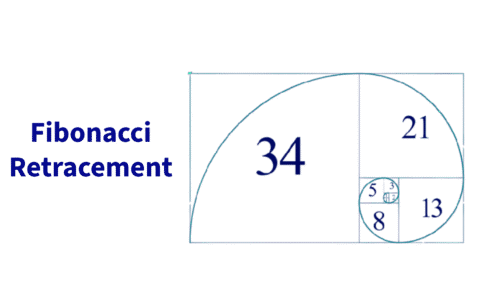
Trading with Fibonacci retracement
What you'll learn
The theory behind Fibonacci retracement and why it works in trading
How to correctly draw and interpret Fibonacci levels on price charts
Identifying confluence zones with Fibonacci and other indicators
Entry, stop-loss, and take-profit strategies using retracement levels
Common mistakes traders make when using Fibonacci — and how to avoid them

Free
Introduction to Livestock
What you'll learn
Livestock Futures – Live Cattle
Live Cattle futures are designed to allow feedlot operators to hedge against a decline in price before they are able to sell the cattle for processing, and for buyers, such as meat packers, to manage the risk of an increase in the price of the cattle they are planning to purchase for processing, or to protect their profit margin for beef they have committed to ship in the future.
Live Cattle futures trade in units of 40,000 pounds and in minimum price increments of $10.00. They are listed for trading in the even months of February, April, June, August, October and December. Live Cattle is a physically-delivered futures contract, meaning that live steers are ultimately delivered. There are specific standards in terms of the quantity and USDA grade of cattle that can be delivered. The details on the delivery requirements and procedures for Live Cattle futures can be found in the CME Rulebook on the CME Group website.
Lean Hogs
Lean Hogs refers to a hog that is ready for processing at about 275 pounds. Hogs are mainly produced in the Midwest, and it typically takes about six months for a pig to become market-ready. The carcass of a market hog weighs about 200 pounds and will typically yield about 155 pounds of lean meat, which is the core of the lean hog futures contract.
Lean Hog futures allow sellers and buyers, such hog producers and packers, to manage the risk of adverse price movements in their operations. Lean Hog futures trade in units of 40,000 pounds of hog carcasses and in minimum price increments of $10.00. They are listed in February, April, May, June, July, August, October and December. As with Feeder Cattle, Lean Hog futures are settled in cash at expiration, to at a price equal to the CME Lean Hog Index on the last day of trading.
Free
Introduction to Fundamental Analysis
What you'll learn
Students will gain a strong foundation in understanding how economic, financial, and political factors drive asset prices. They will learn how to interpret financial statements, evaluate macroeconomic indicators, and connect global events to market movements. The course will also teach how to identify undervalued or overvalued assets, analyze company performance, and apply these insights to build long-term trading or investment strategies.
Free
Introduction to Technical Analysis
What you'll learn
The fundamentals of technical analysis and why it’s used across financial markets.
How to read and interpret candlestick charts and price movements.
Key chart patterns such as head and shoulders, triangles, and flags.
How to identify support and resistance levels for smarter trade entries/exits.
The role of trendlines, moving averages, and momentum in market analysis.
Practical strategies to apply technical analysis in real-world trading scenarios.

Free
Advanced technical analysis
What you'll learn
By the end of this section, students will:
Understand how to apply multi-timeframe analysis for stronger confirmations.
Learn how to use Fibonacci retracements and extensions to spot entry and target zones.
Recognize advanced chart patterns such as Head & Shoulders, Triangles, Flags, and Wedges.
Apply oscillators and momentum indicators (RSI, MACD, Stochastic) in advanced contexts.
Integrate multiple indicators and techniques into a cohesive trading strategy.
Free
Fundamental Analysis
What you'll learn
By the end of this section, students will:
Understand the purpose of fundamental analysis and how it differs from technical analysis.
Learn how economic indicators (GDP, inflation, employment, interest rates) affect markets.
Explore how company earnings, balance sheets, and ratios are used in stock analysis.
Recognize the role of geopolitics and global events in shaping market sentiment.
Combine fundamentals with other tools to create a more complete trading picture.