


Free
Advanced news trading strategies
What you'll learn
Master how to interpret high-impact economic news and assess its potential market reaction
Learn pre-news planning techniques, including entry setups and scenario mapping
Understand market psychology and price behavior during major news releases
Discover advanced strategies like:
Straddle entries
Spike and fade reversals
Post-news breakout confirmation trades
Learn how to avoid fakeouts and whipsaws using timing, filters, and sentiment tools
Apply precise risk management frameworks tailored to high-volatility trading
Analyze real-world trade examples from historical events
Free
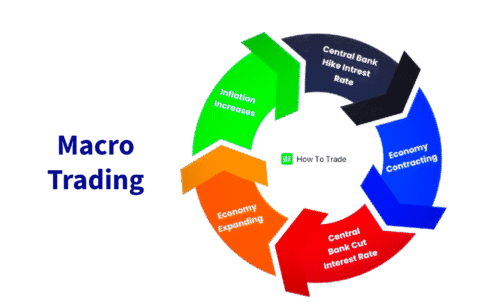
Macro trading
What you'll learn
Understand the core principles of macro trading and how it differs from technical trading
Learn how central bank policies, inflation, interest rates, and economic data affect markets
Discover how to analyze macro indicators such as GDP, CPI, PMI, and NFP reports
Explore how to trade macro themes through Forex, commodities, indices, and bonds
Gain insight into risk management and position sizing for longer-term, macro-based trades
Analyze historical case studies of successful macro trades and market shifts

Free
The London Hammer trading strategy
What you'll learn
Understand the Hammer candlestick pattern and its psychological meaning
Learn how to spot valid Hammer setups during the London session
Discover how to combine this pattern with support/resistance and session timing for high-probability trades
Learn how to place precise entries, stop-losses, and profit targets
Explore the best timeframes and currency pairs for this strategy
Analyze real-world examples of winning and losing trades to understand how to adapt in live markets
Free
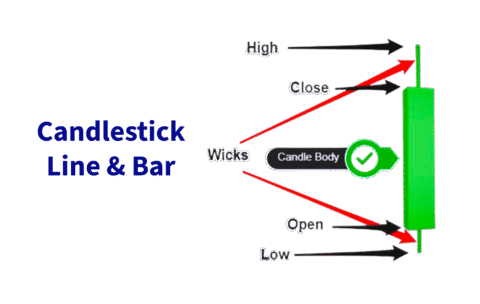
Chart Types: candlestick, line, bar
What you'll learn
Identify and distinguish between candlestick, line, and bar charts
Understand the structure and components of each chart type
Interpret key price information such as open, high, low, and close (OHLC)
Recognize the strengths and weaknesses of each chart type
Apply appropriate chart types to different trading and analysis scenarios
Gain confidence in using charts to support investment decisions

Free
Economic Indicators
What you'll learn
What economic indicators are and why they matter in financial markets
The difference between leading, lagging, and coincident indicators
Key indicators to watch (e.g., GDP, CPI, NFP, interest rates, PMI)
How economic data impacts currencies, stocks, bonds, and commodities
How to use economic calendars and plan around news releases
Free
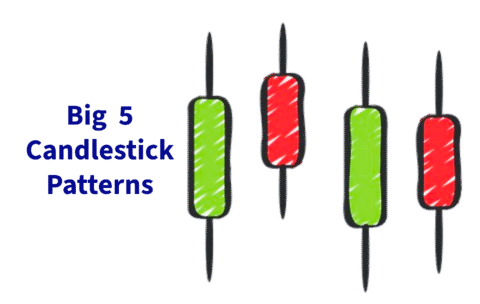
Five Candlestick Patterns
What you'll learn
The structure of candlesticks and how to interpret them
The 5 most important candlestick patterns and what they signal
How to identify bullish vs. bearish formations
Real-world chart examples of each pattern in action
How to incorporate candlestick patterns into your trading strategy

Free
Trade the Non-Farm Payrolls
What you'll learn
What the NFP report is, how it's calculated, and why it moves markets
How to interpret NFP data alongside unemployment rate and average hourly earnings
Pre-release strategies: how to prepare using forecasts, sentiment, and positioning
Live trading strategies for high-volatility conditions (breakouts, fades, traps)
Post-release analysis and how to adjust your trading plan based on the results

Free
Consumer Price Index
What you'll learn
What the Consumer Price Index (CPI) is and how it measures inflation
Why CPI is closely watched by central banks like the Federal Reserve and ECB
How CPI data impacts markets such as forex (USD pairs), gold, indices, and bonds
Pre-release analysis techniques, consensus expectations, and market positioning
Trading strategies for before, during, and after CPI announcements, including volatility setups
Free
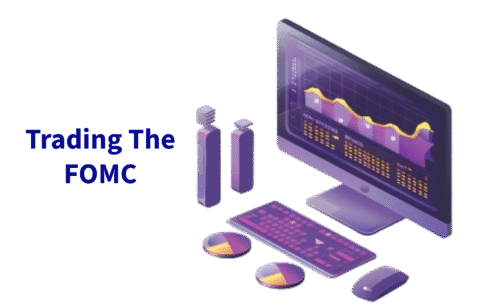
A Guide to Trading the FOMC
What you'll learn
What the FOMC is, how it functions, and why its meetings move markets
How interest rate decisions and monetary policy statements impact asset prices (e.g., USD, gold, indices)
How to interpret the dot plot, economic projections, and Fed Chair press conferences
Pre-FOMC preparation: analyzing consensus, sentiment, and market positioning
Real-time and post-announcement trading strategies, including breakout and fade setups
Free
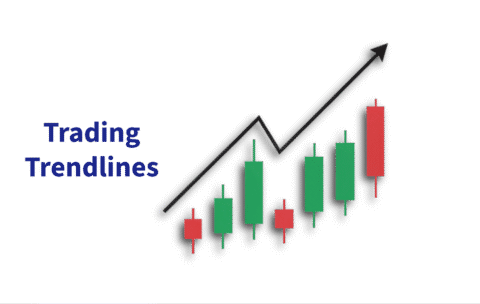
Trading Trendlines
What you'll learn
A trend line can indicate whether or not a trend is present. If a trend line has a positive slope, there is a positive association between the variables. If a trend line has a negative slope, there is a negative association between the variables.

Free
Intro Trading Candles
What you'll learn
By the end of this section, students will:
Understand the structure of a candlestick (open, high, low, close).
Recognize the difference between bullish and bearish candles.
Identify common candlestick patterns that signal market sentiment.
Learn how to use candles to spot potential reversals and continuations.
Apply candlestick reading as a foundation for broader technical analysis.